Add a canary stage to a pipeline
If you have enabled canary for your application and have one or more canary configs prepared , you can now add a canary stage to your pipeline and configure it to perform canary analysis for your deployment.
This stage type is for the canary analysis only. The canary stage doesn’t perform any provisioning or cleanup operations for you. Those must be configured elsewhere in your pipeline.
About the canary stage
The canary analysis can be performed over data points collected beginning from the moment of execution and into the future, or it can be performed over a specified time interval.
Real-time versus retrospective analysis
A real-time analysis means that the canary analysis is performed over a time interval beginning at the moment of execution. In a retrospective analysis the canary analysis is performed over an explicitly specified time interval (likely in the past).
Metric scope
Metric scope defines where, when, and on what the canary analysis occurs. It describes the specific baseline and canary server groups, the start and end times and interval, and the cloud resource on which the baseline and canary are running.
You can also refine the scope using extended params .
Define the canary stage
-
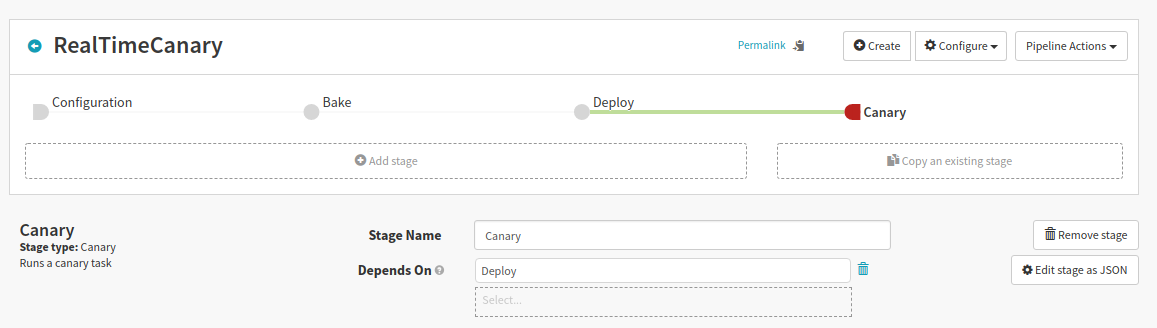
In the pipeline in which you will run the canary, click Add stage.
This pipeline needs to be in an application that has access to the canary configuration you want to use.
-
For Type select Canary.
-
Give the stage a name, and use the Depends On field to position the stage downstream of its dependencies.
-
Select the Analysis Type—either Real Time or Retrospective.
-
Real Time
The analysis happens for a specified time period, beginning when the stage executes (or after a specified Delay).
For Real Time, also specify the number of hours to run (Lifetime).
-
Retrospective
Analysis occurs over some specified period. Typically, this is done for a time period in the past, against a baseline deployment and a canary deployment which have already been running before this canary analysis stage starts.
Note that this analysis might analyze data for resources which no longer exist, for which there are still published time series.
-
-
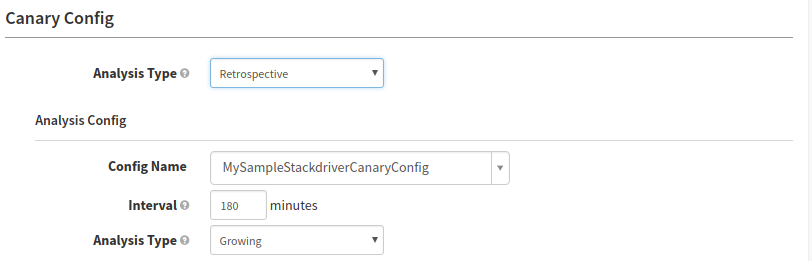
Specify the analysis configuration:
-
Choose the Config Name.
This is the canary config you created here . That configuration must be visible to this application. By default, all configs are visible to all applications, but your canary might be set up so that each config is limited to the application in which it is created.
-
Set a Delay.
For real-time analyses, how many minutes to wait before starting the analysis. The gives both the baseline and canary a chance to get “warmed up” before they’re expected to provide meaningful metrics. Leave blank for a delay of zero minutes.
-
Set the Interval.
This is how frequently (in minutes) to capture and score the metrics.
-
For Lookback Type, select Growing or Sliding.
-
In a growing analysis, a judgment is taken every [interval] minutes, but each judgment goes all the way back to the beginning of the Lifetime.
-
A sliding Lookback also makes a judgment every [interval], but each judgment only looks at the data from the most recent lookback duration. It would not be unusual for the Interval and the look-back duration to be the same, but they don’t have to be.
-
-
-
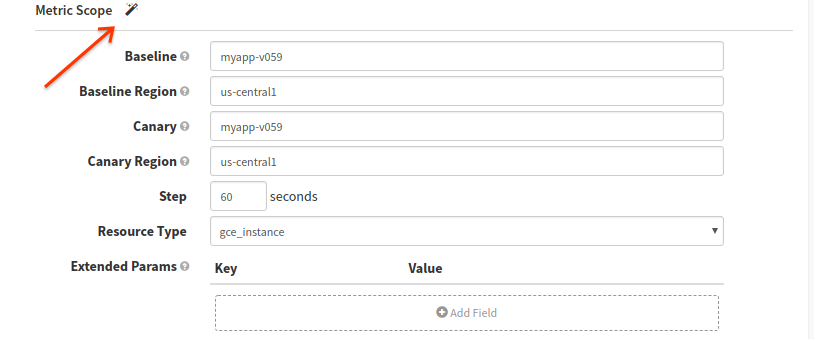
Describe the metric scope.
You can enter server groups and regions by name, but you can also click the magic wand here to automatically populate the fields with expressions that resolve to available resources. Those resources are a starting point, which you can edit to match the specific resources you need.
-
Baseline
The server group to treat as the “control” in the canary analysis—that is, the deployment against which to compare the canary deployment.
-
Baseline Region
The region in which the baseline server group is deployed.
-
Canary
The server group to treat as the experiment in the analysis.
-
Canary Region
The region in which that canary server group is deployed.
-
Step
The interval, in seconds, for the metric time series.
-
Start Time and End Time (for retrospective)
For a retrospective analysis, the specific time span over which to conduct the analysis.
-
Add any additional parameters, which are specific to the metric sources and which can be used to refine the scope of the analysis. These parameters can provide variable bindings for use in the expansion of custom filter templates specified in the canary config .
-
-
Adjust the Scoring Thresholds, if needed.
The thresholds are pre-populated based on those configured in the main canary config , but you can override them here.
-
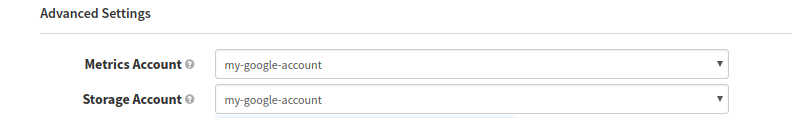
Specify the accounts you’re using for metrics and storage.
-
The Metrics Account points to the telemetry service provider account you configured here .
-
The Storage Account points to the GCS or S3 account you configured here .
-