Configure a canary
Before you can add a canary stage to a pipeline, you need to configure what the canary consists of, including:
- A name by which a canary stage can choose this config
- The specific metrics to evaluate, and a logical grouping of those metrics
- Default scoring thresholds (which can be overridden in the canary stage)
- Optionally, one or more filter templates
Canary configuration is done per Spinnaker application . For each application set up to support canary, you create one or more configs.
Note: By default, all the canary configs you create are visible to all applications. But you can change that .
The configuration you create here is available to canary stages in pipelines, but those stages are defined separately .
Prerequisites
By default, canary is not enabled for new applications. Several things need to happen before you see the Canary tab in Deck:
-
The person or people setting up Spinnaker for you must set up Canary .
This includes specifying whether all canary configs are available to all applications (the default) or each application can have one or more configurations that are visible to that application only.
-
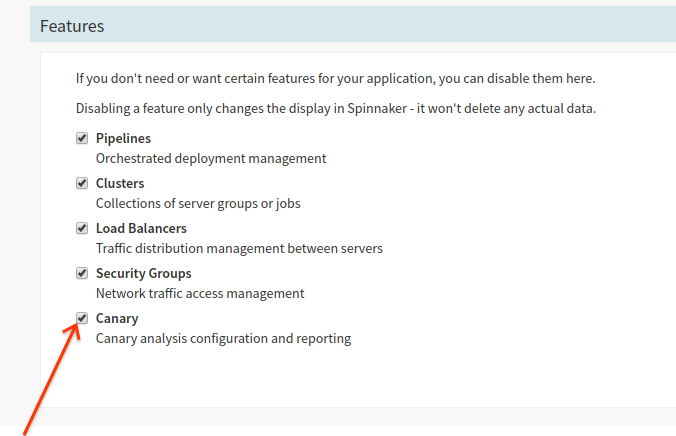
In the Application config, activate the Canary option.
Do this separately for all applications that will use automated canary analysis.
Create a canary configuration
You can create as many of these as you like, and when you create a canary stage, you must select a canary configuration to use. Configurations you create within an application are available to all pipelines in that application, but your Spinnaker might be set up so that all configurations are available to all applications.
-
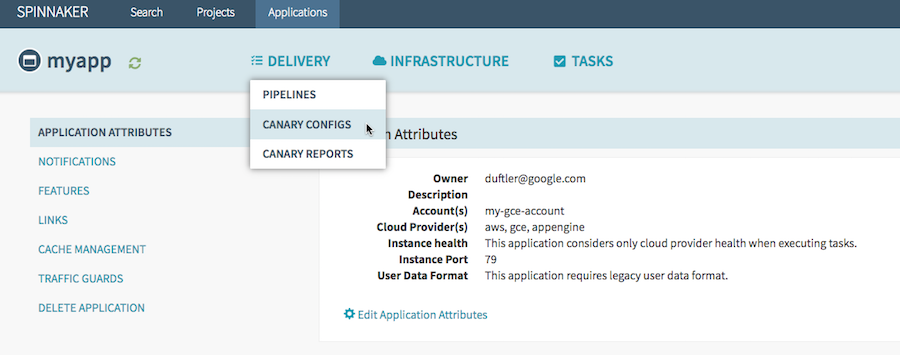
Hover over the Delivery tab, and select Canary configs.
-
Select Add configuration.
-
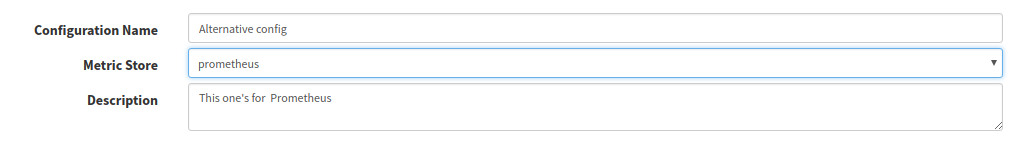
Provide a Name and Description.
This is the name shown in the stage config when you create a canary stage for your pipeline.
-
(Optional) select your telemetry provider from the Metric Store dropdown.
If you have only one provider set up, this drop-down is not shown.
The sections below describe how to specify the metrics and the scoring thresholds and weights.
Create metric groups and add metrics
The metrics available depend on the telemetry provider you use. Spinnaker currently supports Stackdriver , Prometheus , Datadog , Signalfx , and New Relic .
Metrics are evaluated even if they’re not added to groups, but if you want to apply the weighting that determines the relative importance of different metrics, you need to add them to groups .
-
Create any groups you want to organize the metrics into.
Data is evaluated for all metrics, but metrics scores only affect the canary evaluation for metrics that are grouped here.
Click Add Group to create each group you’ll use. Then select the group and click the edit icon to name it.
For example, you might create a group called “cpu” and add a set of CPU-related metrics. Then when you configure a new metric here, you would select “cpu” for the CPU-related metrics you add.
-
In the Metrics section, select Add Metric.
-
Select the group to add this metric to.
-
Give the metric a name.
-
Specify whether this metric fails when the value deviates too high or too low compared to the baseline.
Or select either, in which case it fails on deviation in either direction.
-
Optionally, choose a filter template .
This is only available if your Spinnaker is setup with canaries.
Here’s an example:
resource.type = "gce_instance" AND resource.labels.zone = starts_with("${zone}") -
Identify the specific metric you’re including in the analysis configuration:
-
In the Metric Type field type at least 3 characters to populate the field with available metrics.
For example, if you type
cpuyou get a list of metrics available from your telemetry provider.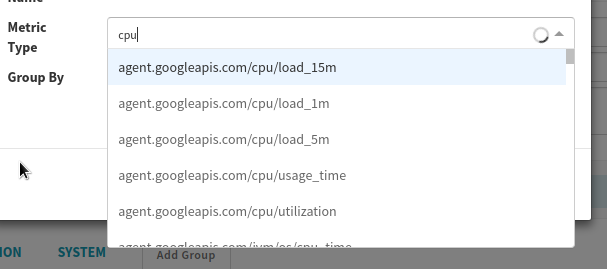
-
-
Optionally, if your telemetry provider supports aggregation of results, click Group by and enter the metric metadata attribute by which to group and aggregate the data.
For example, when you create a metric you can group its time series by resource or metric label. You can group a time series by zone, for example (
resource.zone). This is supported in Stackdriver and Prometheus only.Metric groups versus grouping metrics
When you create a canary configuration, you create metric groups , and scoring thresholds and weights are applied to groups (rather than to specific metrics). But the grouping described in this step is for aggregating metrics before they’re returned to Kayenta.
-
Click OK to save this metric.
Your metric is now listed under the specific group you selected for it, and under All.
Add filter templates
If your telemetry provider is Stackdriver, Prometheus, or Datadog, you can add filter templates and then assign each metric a filter template, if you want.
-
Click Add Template.
-
Provide a Name.
This is the name by which you can select it when configuring the specific metric.
-
In the Template field, enter an expression using the FreeMarker template language.
See the interpolation syntax here .
The expression is expanded using the variable bindings specified via the Extended Params in any canary stage that uses this configuration.
These variable bindings are also implicitly available:
project,resourceType,scope,location
Advanced metric configuration
Each metric supports additional configuration options in the analysisConfigurations.canary
section of the JSON config. These options control how the judge handles the metric:
NaN and missing data
| Option | Default | Description |
|---|---|---|
nanStrategy |
remove |
How to handle NaN values: remove (filter out) or replace (replace with 0.0) |
mustHaveData |
false |
If true, missing data causes the metric to fail (NodataFailMetric) |
critical |
false |
If true, a High/Low classification fails the entire canary (score = 0) |
muted |
false |
If true, metric is excluded from scoring but still shown in results |
Effect size thresholds
| Option | Default | Description |
|---|---|---|
effectSize.measure |
meanRatio |
Effect size measure: meanRatio or cles |
effectSize.allowedIncrease |
1.0 |
Ratio threshold for High classification |
effectSize.allowedDecrease |
1.0 |
Ratio threshold for Low classification |
effectSize.criticalIncrease |
1.0 |
Ratio threshold for critical High (requires critical: true) |
effectSize.criticalDecrease |
1.0 |
Ratio threshold for critical Low (requires critical: true) |
Outlier removal
| Option | Default | Description |
|---|---|---|
outliers.strategy |
keep |
Outlier handling: keep or remove |
outliers.outlierFactor |
3.0 |
IQR multiplier for outlier detection |
Example JSON configuration
{
  "name": "error-rate",
  "analysisConfigurations": {
    "canary": {
      "direction": "increase",
      "nanStrategy": "replace",
      "critical": true,
      "effectSize": {
        "allowedIncrease": 1.1,
        "criticalIncrease": 1.5
      }
    }
  }
}
For details on how these options affect the judge’s behavior, see How canary judgment works .
Edit a configuration
-
On the Delivery tab, select Canary Configs.
All available existing configs are listed along the left margin. Note that the application that owns a config is shown under the name, in cases where configs are scoped to individual applications.
-
Select the config you want to edit.