Captain's Log: The State of Spinnaker
Welcome to the Captain’s Log! This report on the state of Spinnaker contains regularly updated project contribution and code repository metrics, to visualize the story of the Spinnaker’s growth across its ecosystem.
Success stories from around the web tell of enterprises moving from brittle deployments to continuous delivery with Spinnaker:
- Airbnb uses Spinnaker to migrate from monolith to service-oriented architecture.
- SAP leverages Spinnaker on its mission to run the world better.
- Pinterest boosts productivity with Spinnaker as it pioneers visual discovery.
- Mercari champions Spinnaker as a safeguard against deployment fear while releasing new services.
- Salesforce adopted Spinnaker to bake images for both Kubernetes and VMs, to support its complex delivery requirements.
Spinnaker’s trajectory
Our community began as a partnership between Netflix and Google, eager to share the benefits of Continuous Delivery. Now it’s a vibrant open source project, attracting hundreds of companies to participate as it evolves, integrating unique use cases and tools. Behold!
GitHub events in Spinnaker repositories
After steadily building momentum since its first open source release in 2015, Spinnaker activity takes off. In December 2019, significant events within a week achieved a recent high of more than 4 times the weekly average so far: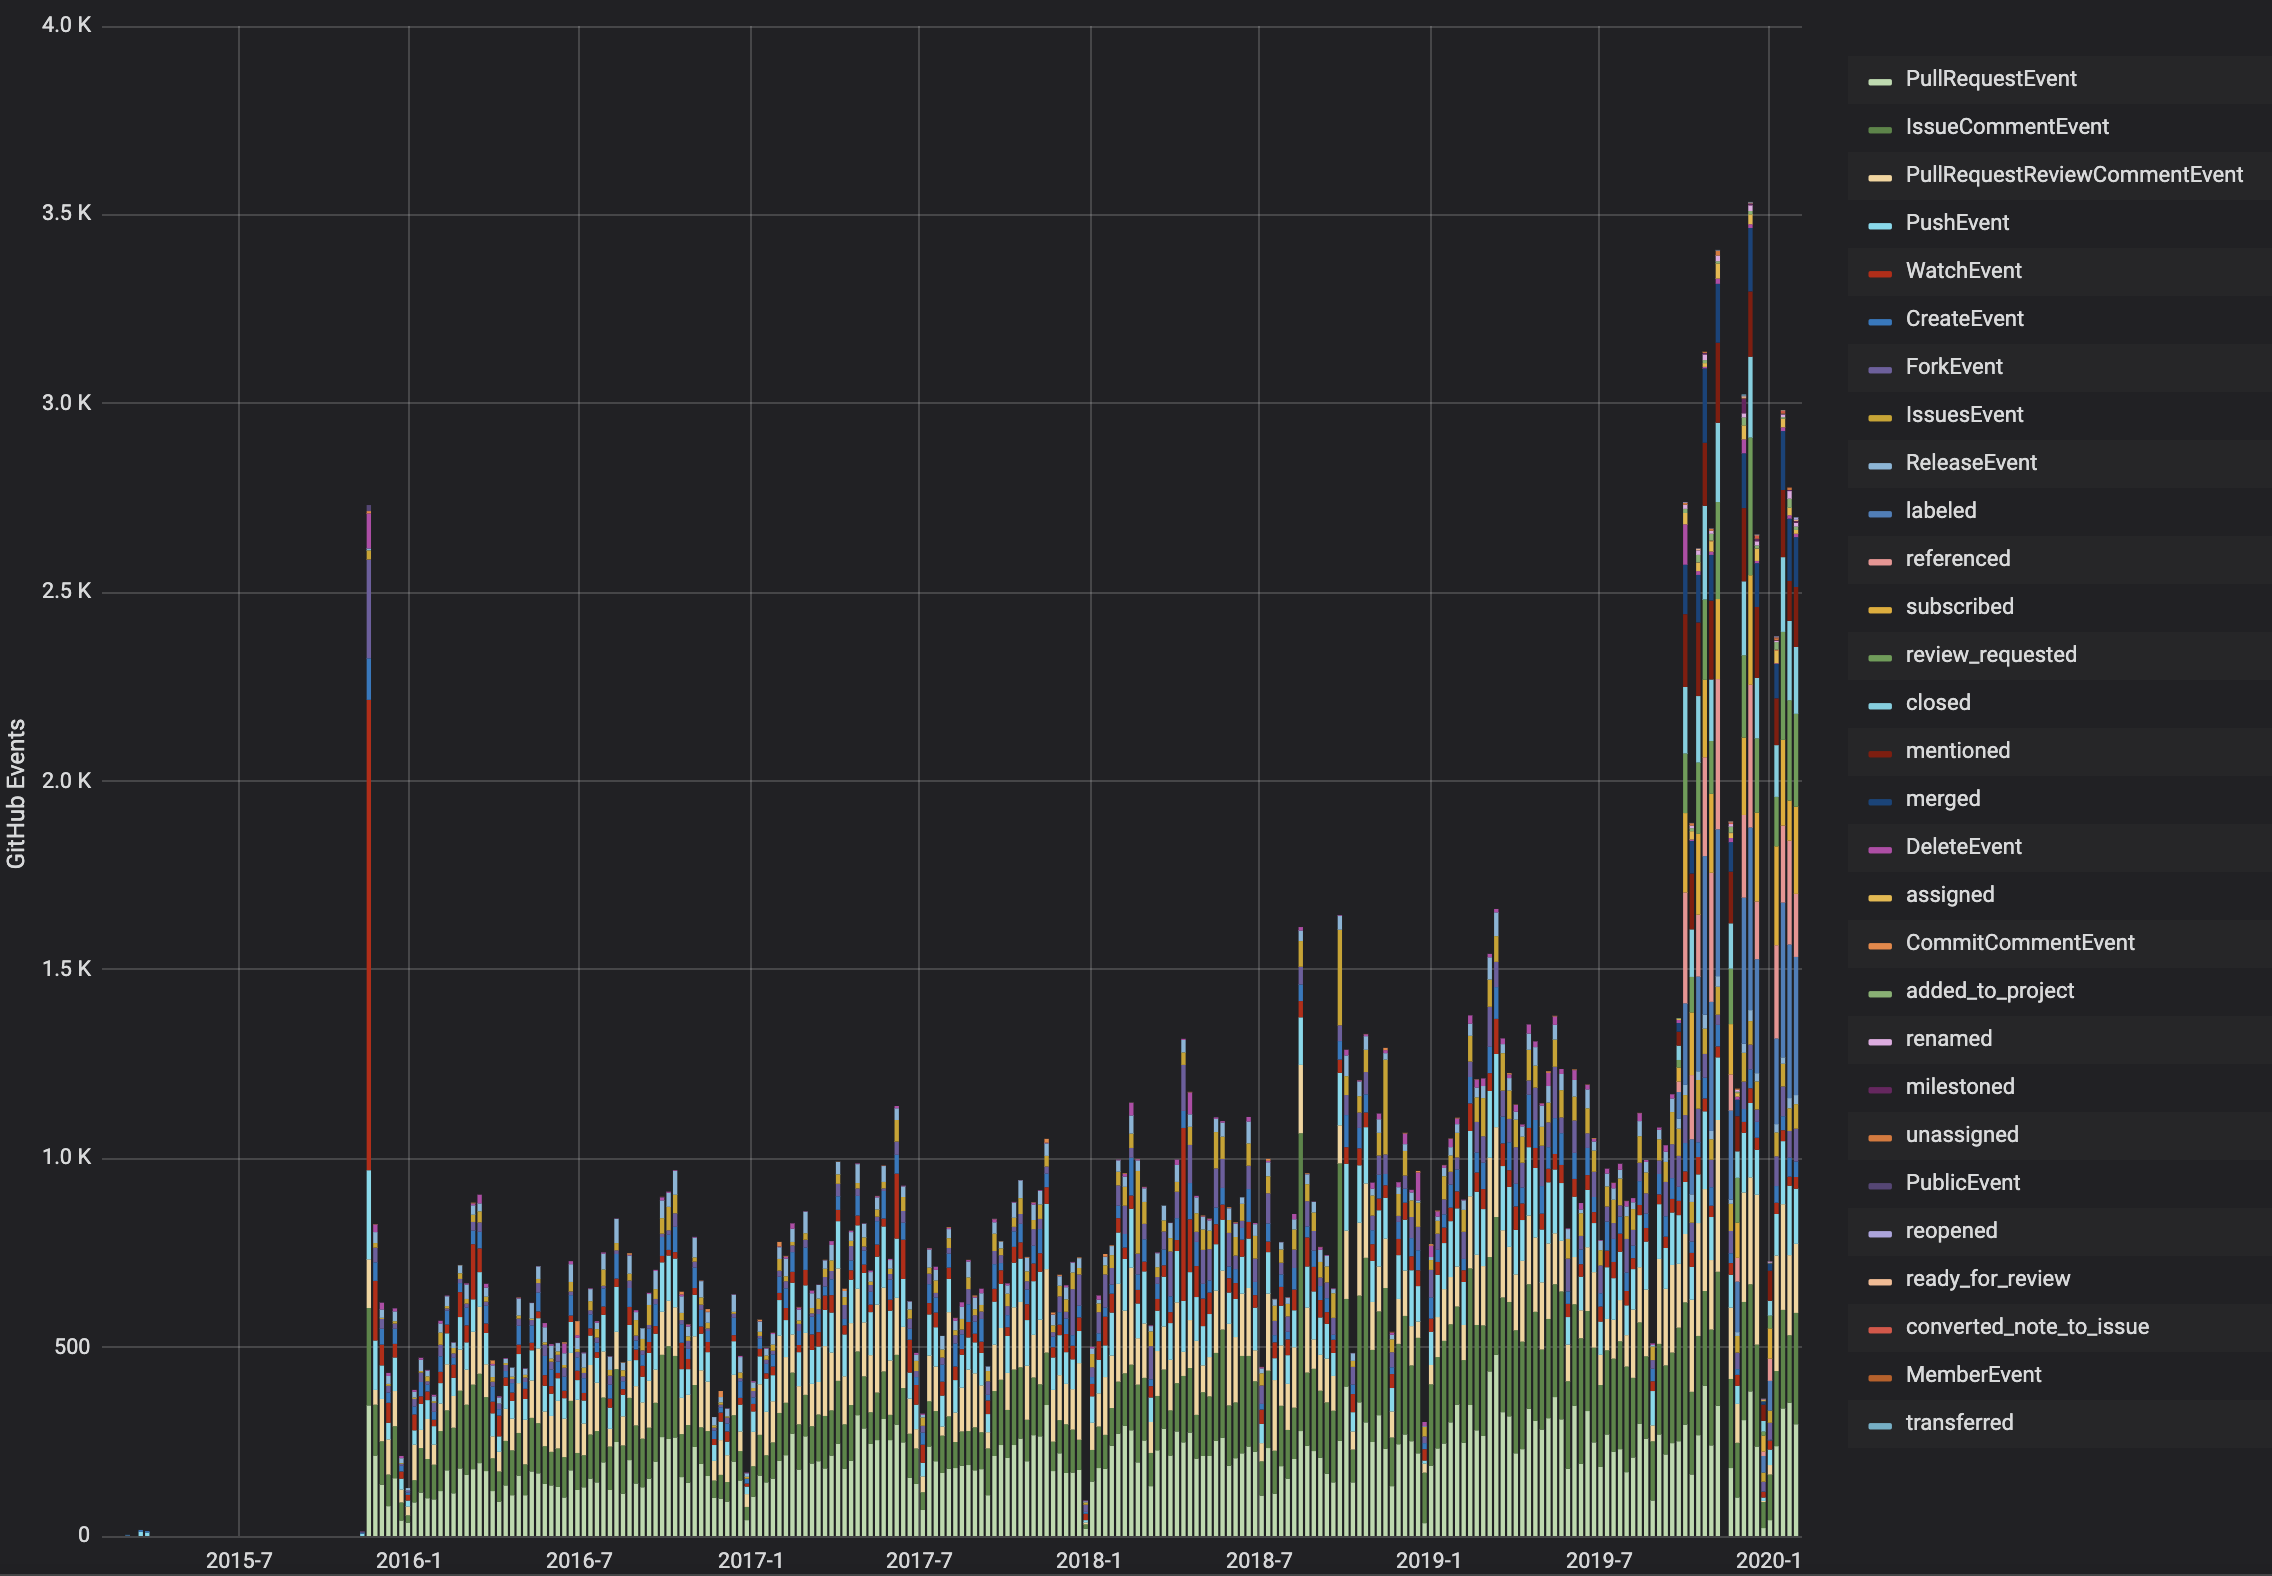
Contributions per company
Building from a committed base of key organizations, 2019 saw a rise in contributions from end-user companies and new stakeholders like Armory, OpsMx, and Amazon. The average number of contributions from companies besides Netflix and Google in H2 2019 was more than 2.5 times the average from December 2015 to today: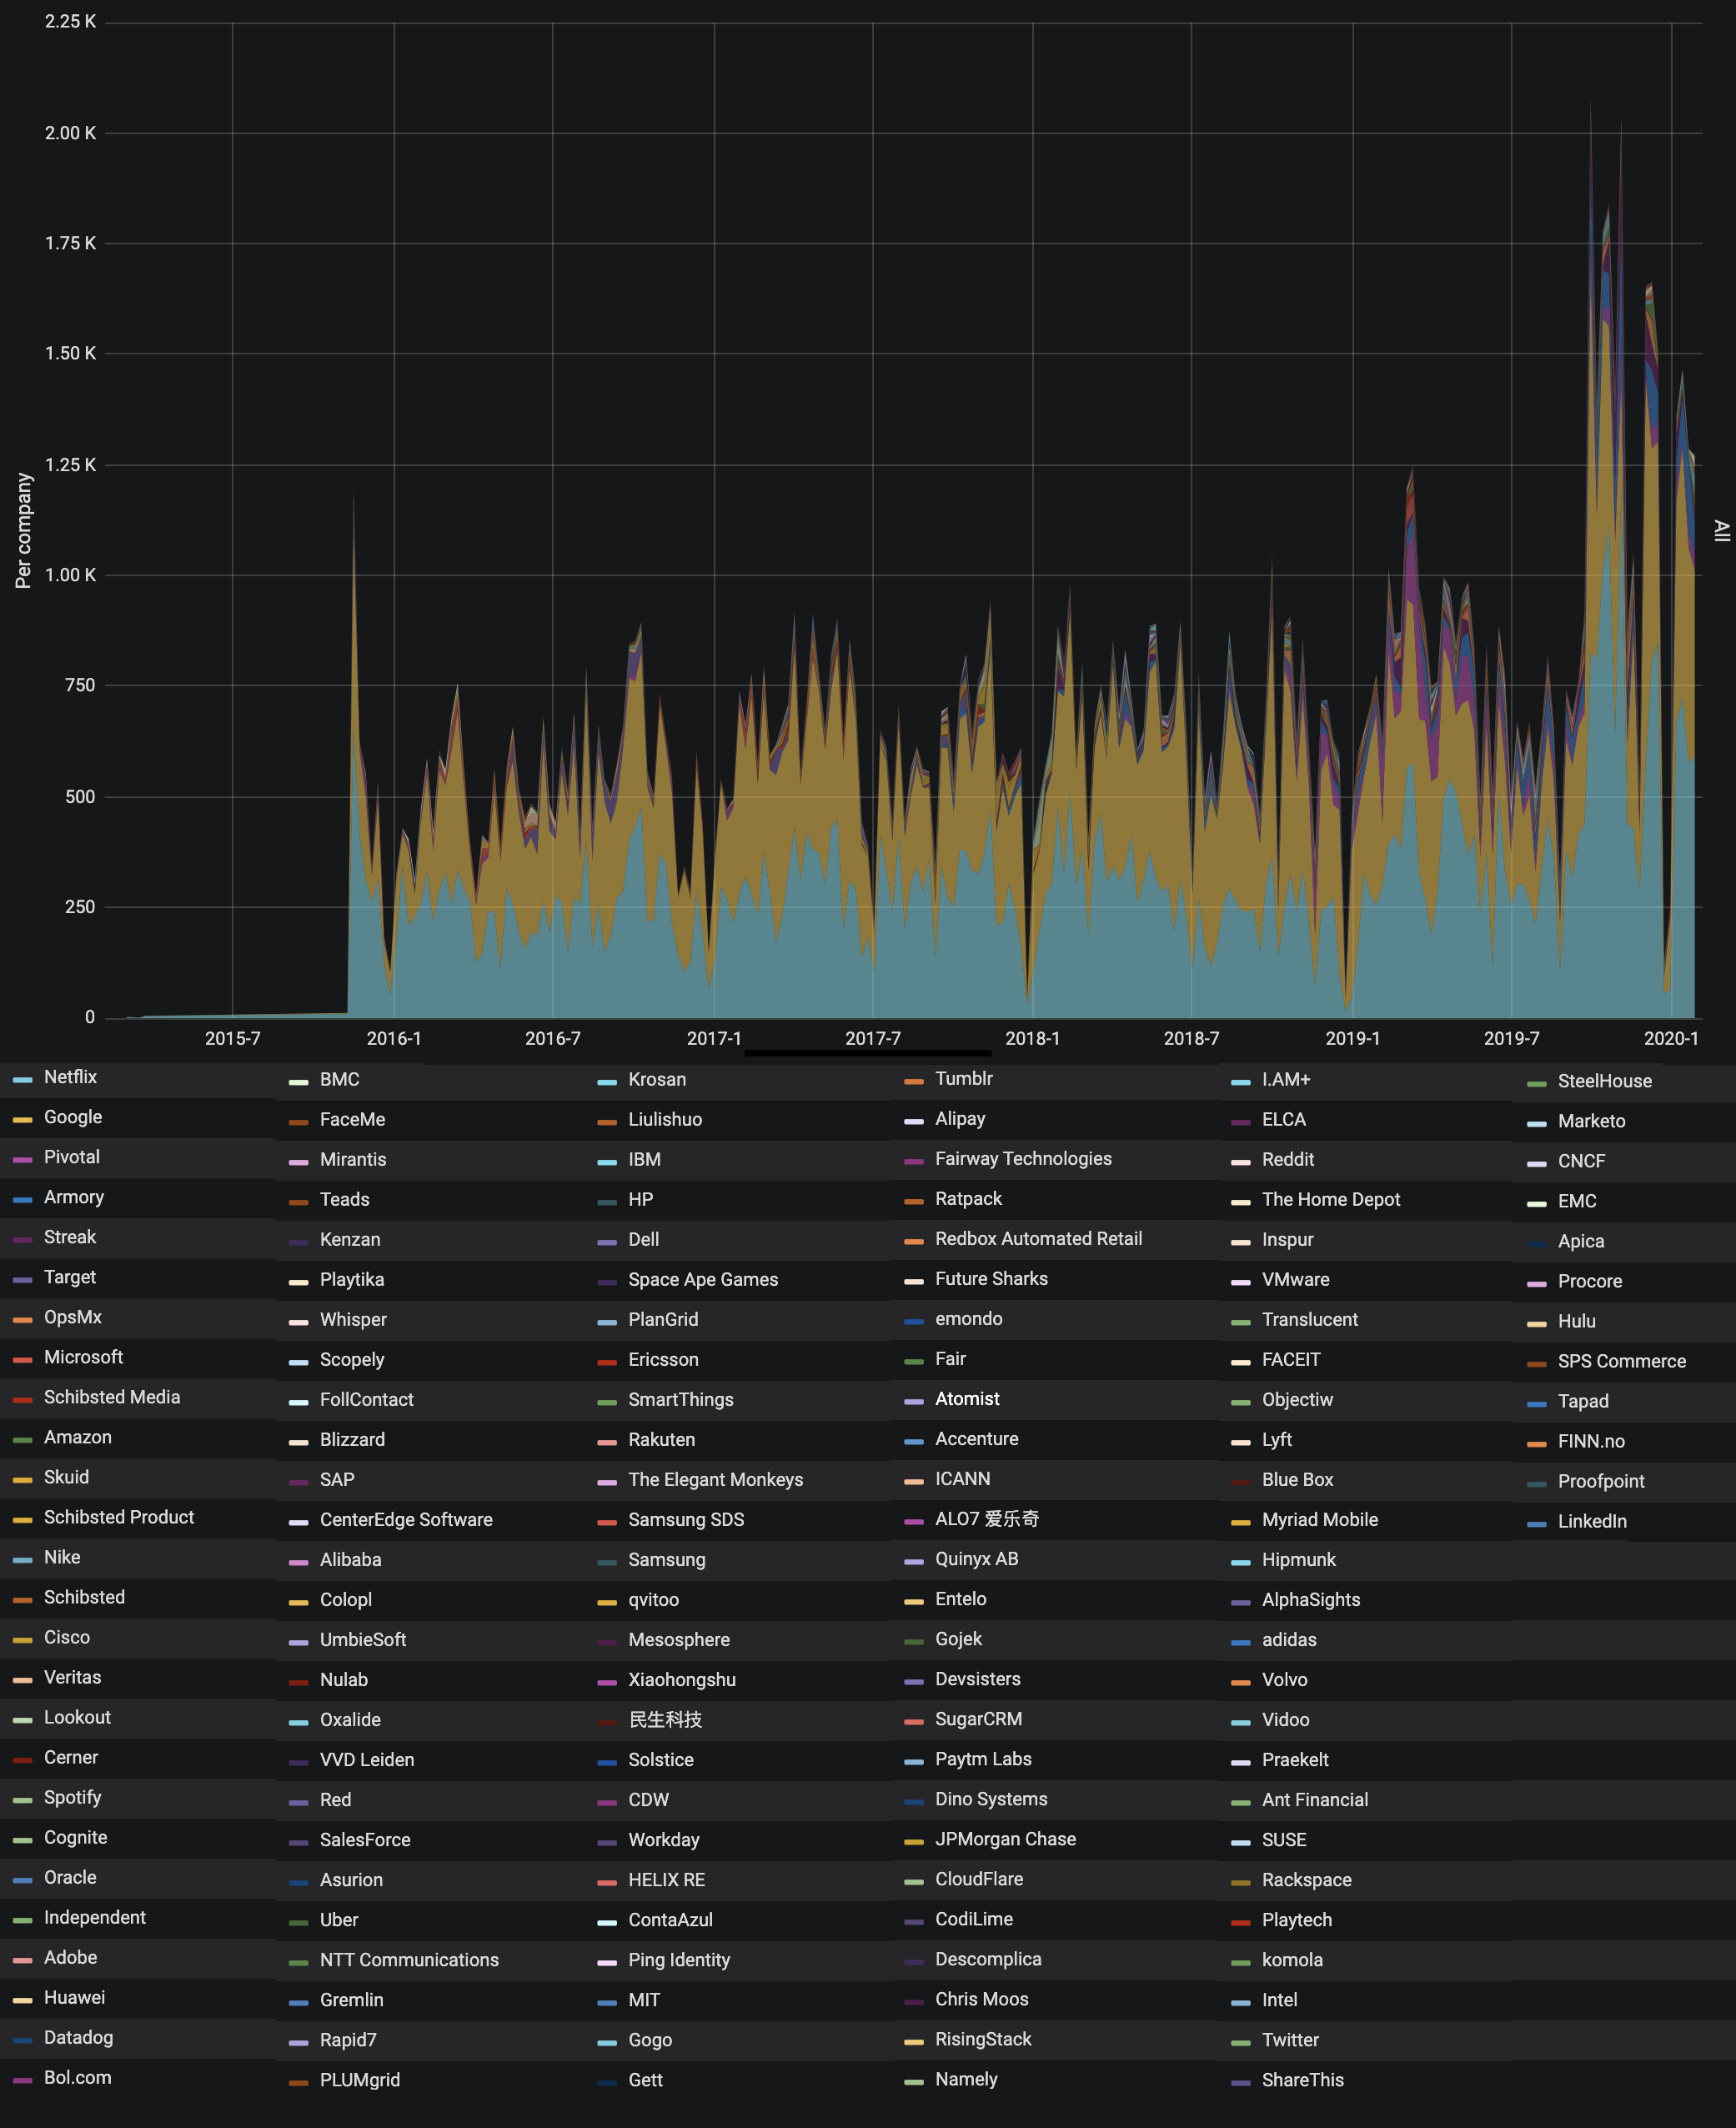
Activity by repository
The Spinnaker ecosystem currently includes 44 repositories, including the microservices that deliver its core functionality and interface with deployment targets such as AWS, GCP, and Kubernetes. Added as the project has diversified: cleanup and monitoring tools, documentation, governance, community resources, and much more: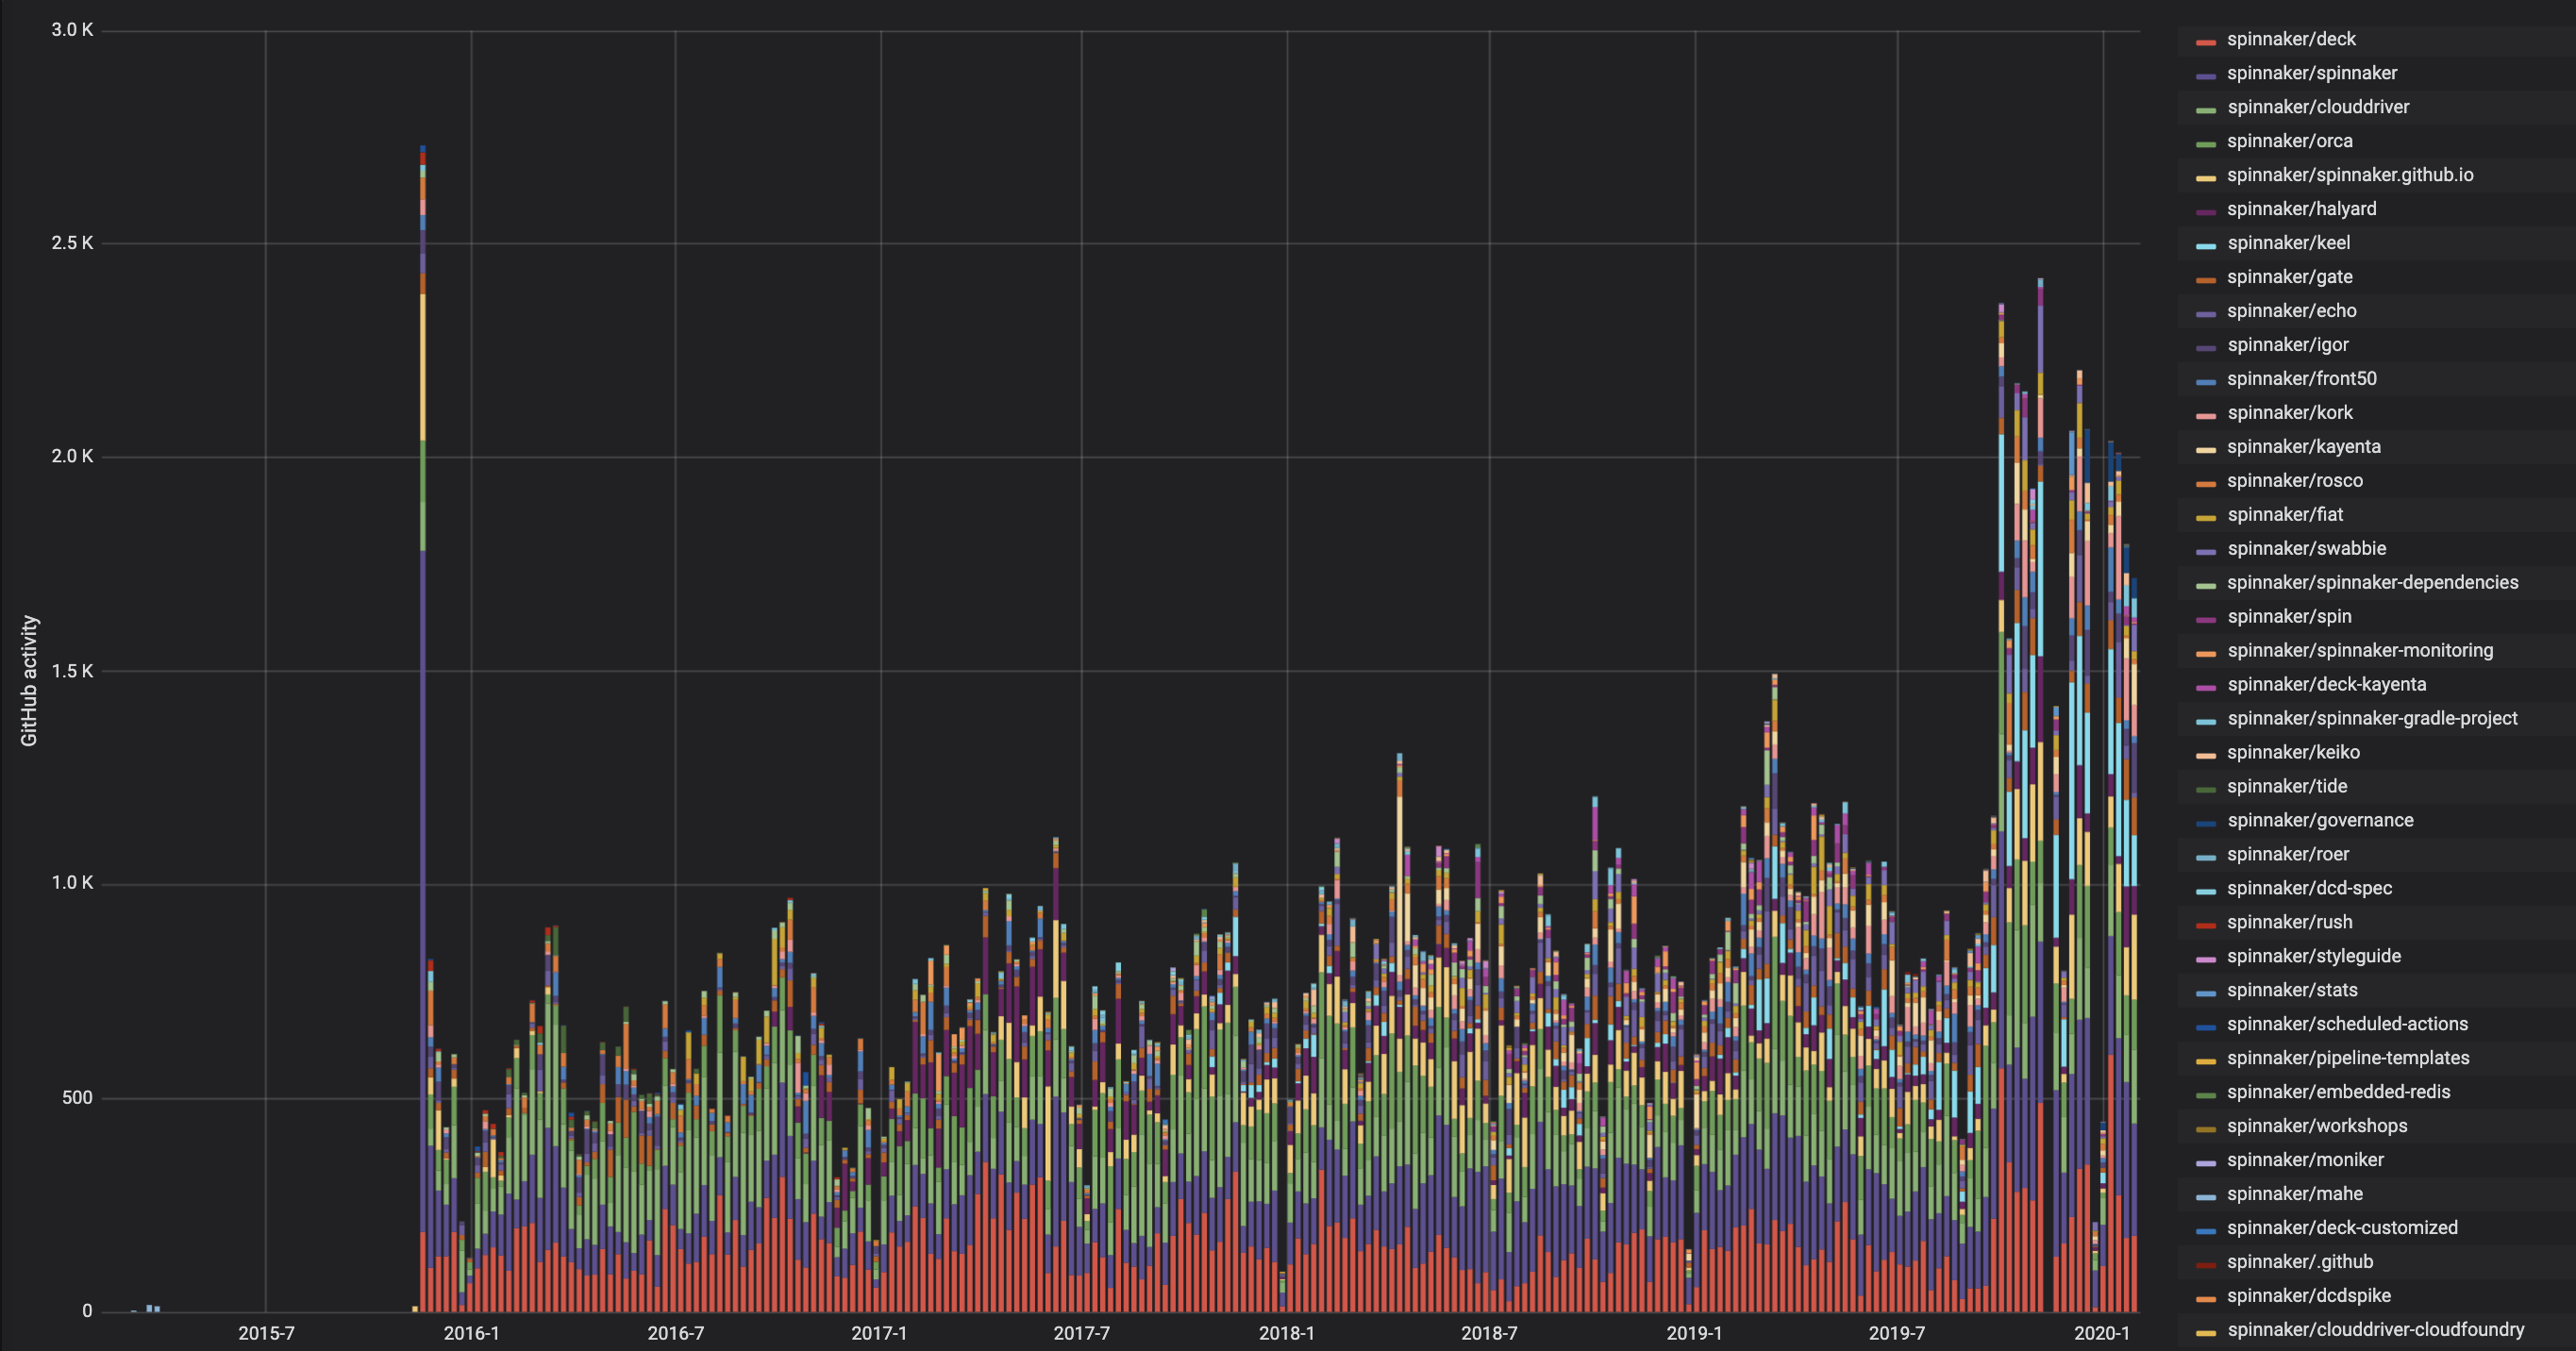
Companies and developers contributing each week
Spinnaker has seen steadily increasing engagement from companies, and spikes of developer activity around community initiatives. The average weekly number of contributing developers was double the prior average in 2019, with up to 21 companies and 124 developers contributing each week: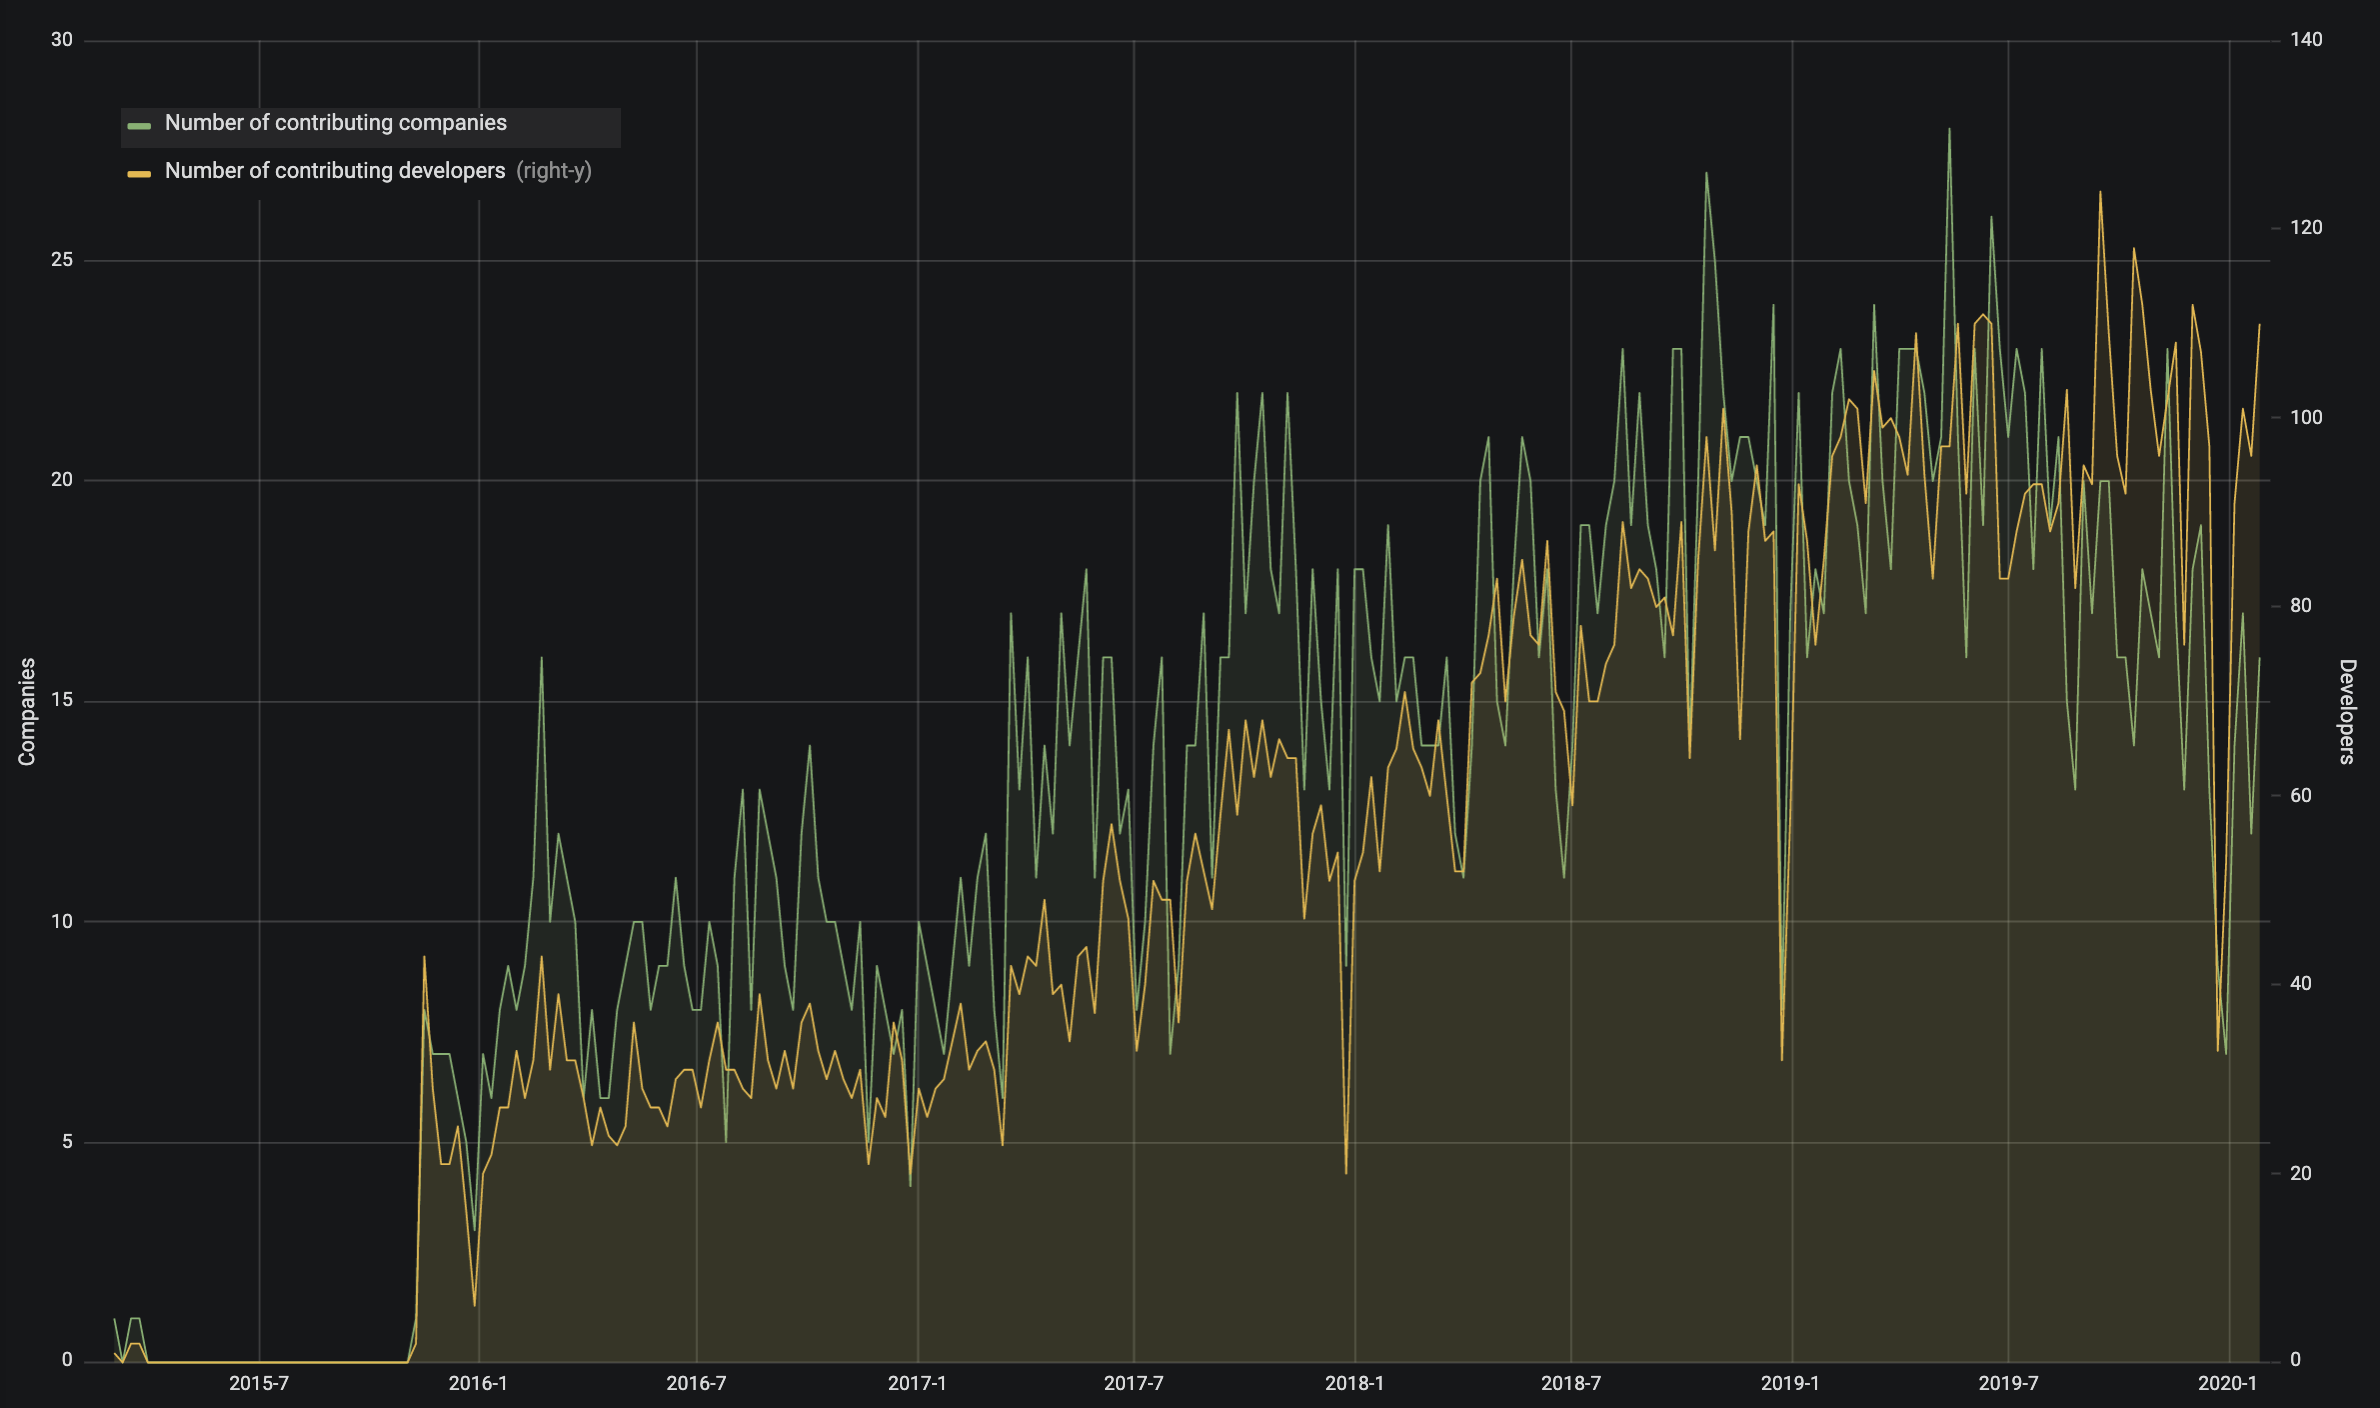
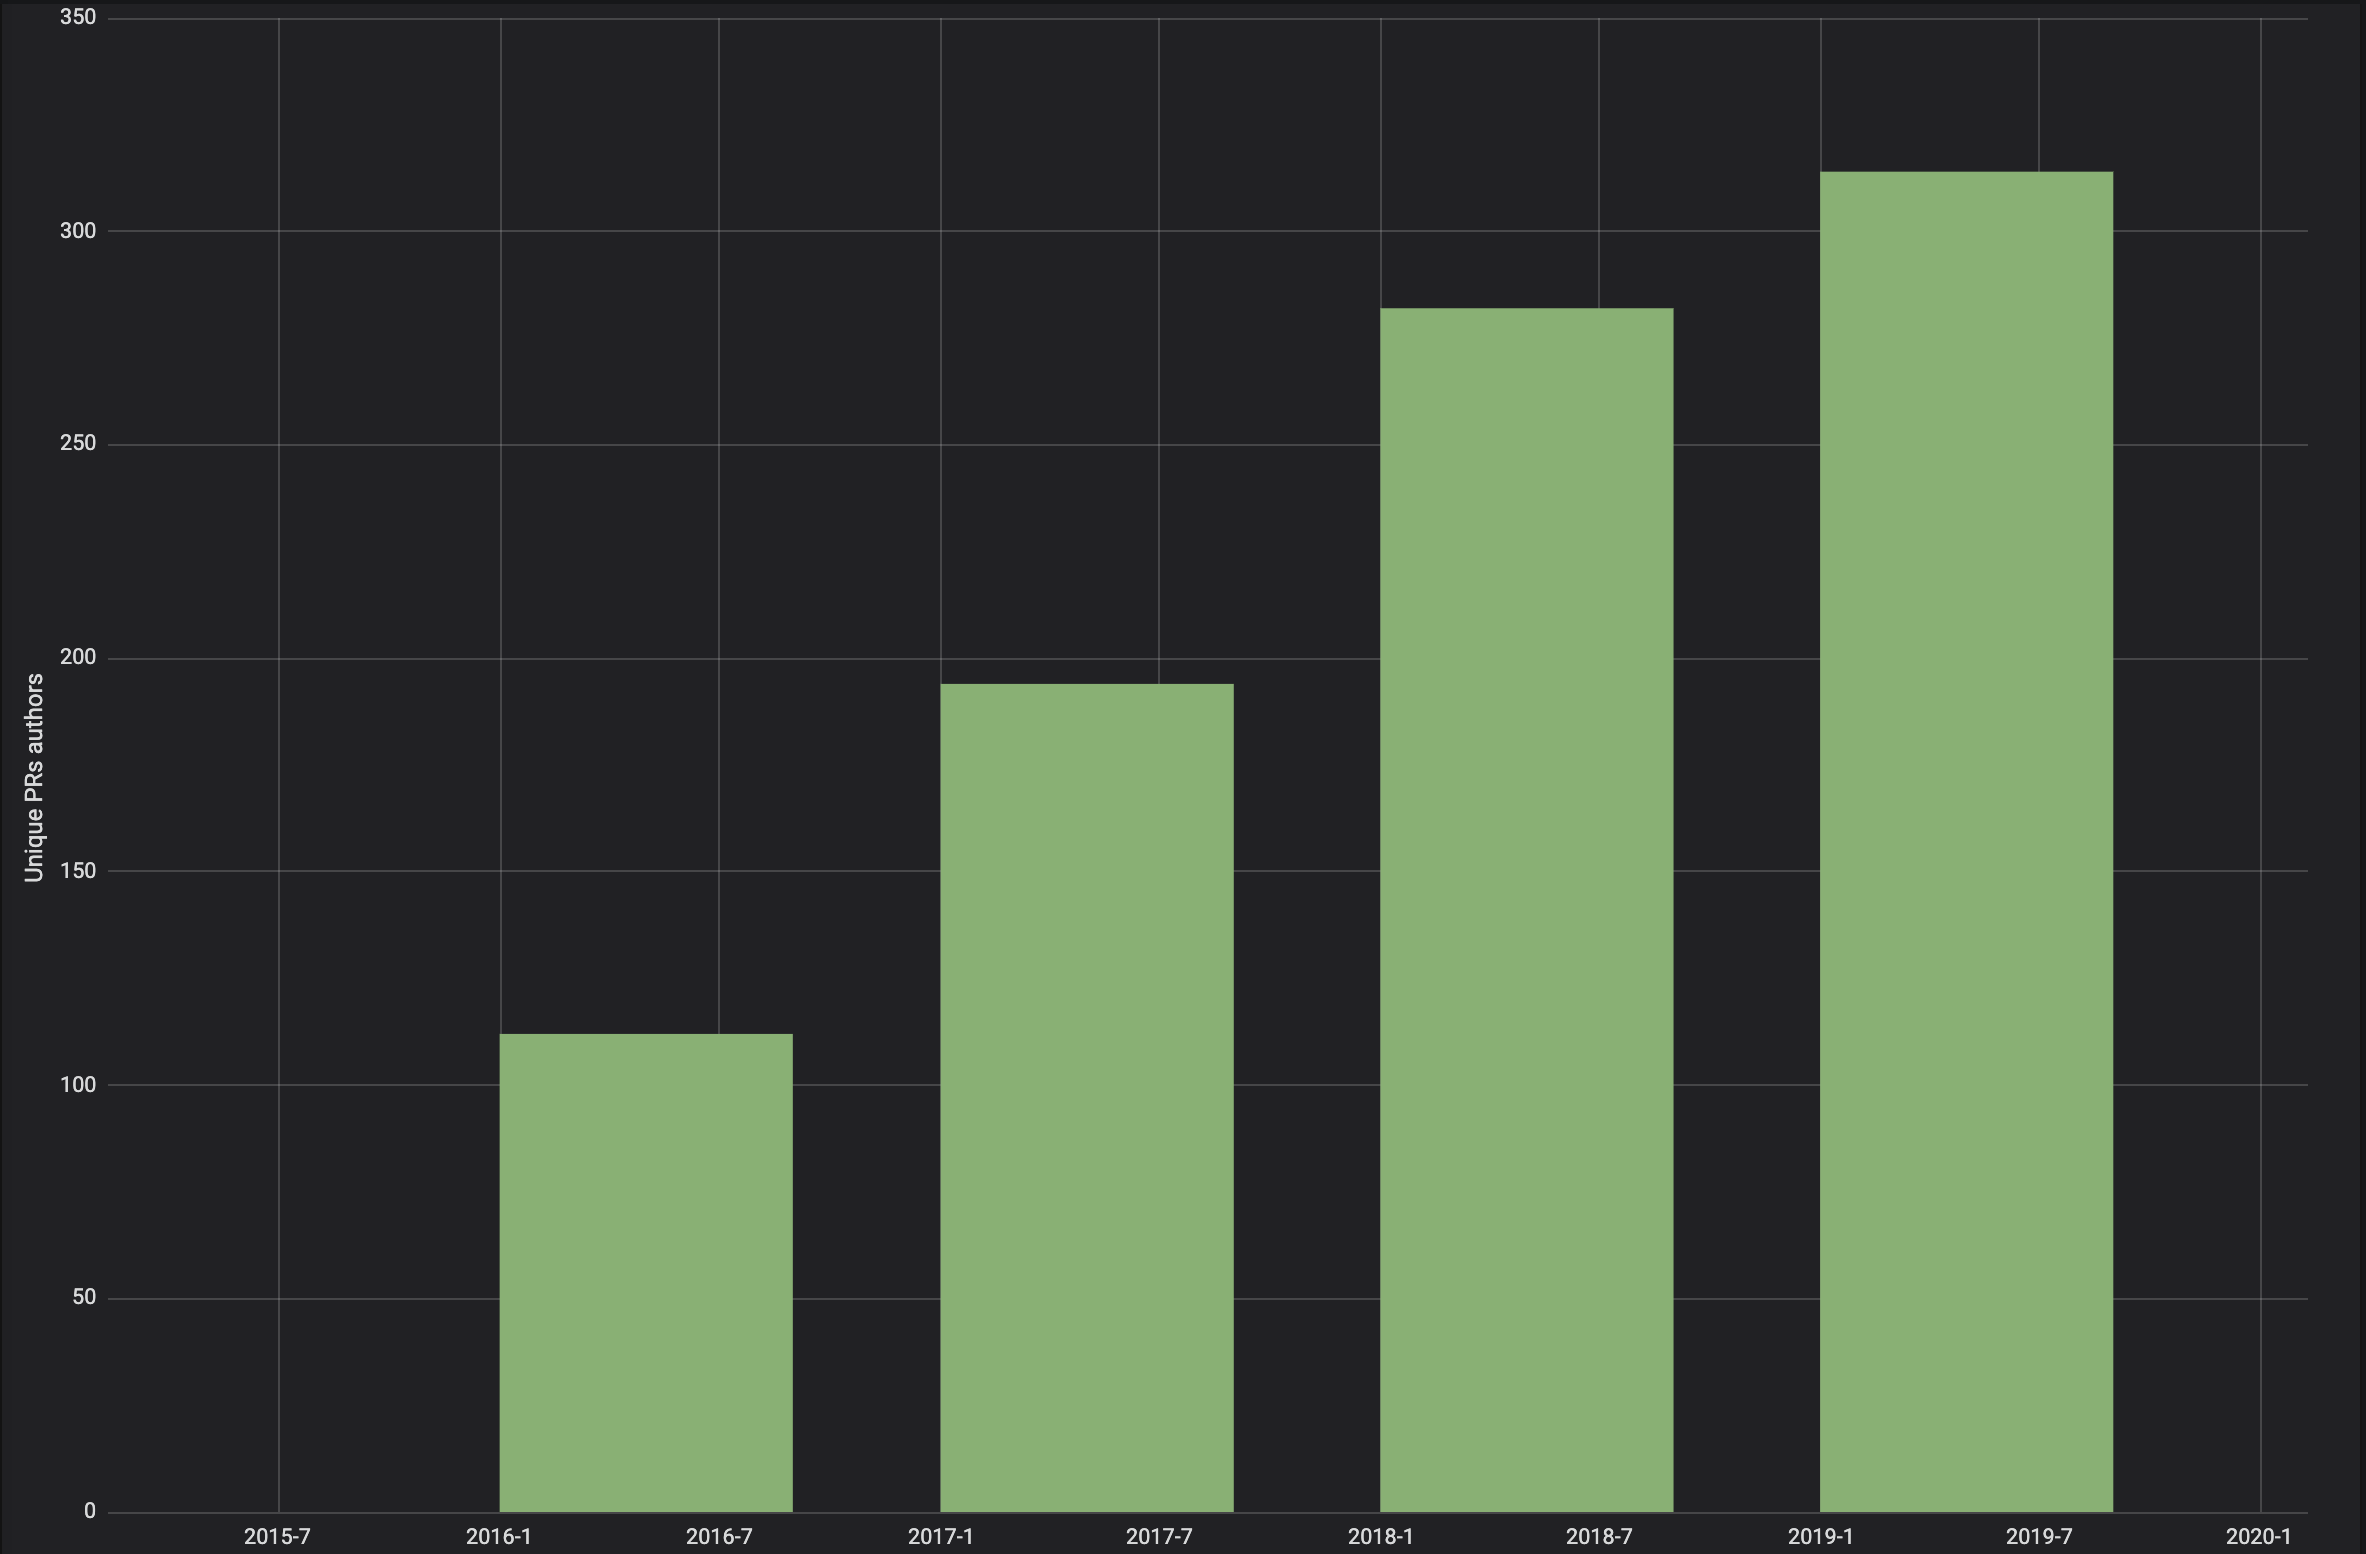
Myriad pull request contributors
Authors contribute pull requests to Spinnaker repositories each week, building the project collaboratively over time. In 2019, 314 unique developers submitted PRs, compared to 282 in 2018, and 194 in 2017:
Visit Spinnaker DevStats for more!
The data presented here comes from Spinnaker’s DevStats Dashboard, an awesome project growth visualization and monitoring tool built by CNCF engineers in collaboration with Kubernetes and other CNCF project communities. DevStats defines a “contribution” as a review, comment, commit, PR, or issue. Big thanks to Lukasz Gryglicki and the CNCF!
Last updated February 2020